This blog offers informed opinions and perspectives relating to nascent technologies in data-centric engineering. Matthew Jones (Shell) and Philip Jonathan (Shell, Lancaster University) introduce ideas from extreme value statistics and discuss practical challenges related to their publications in weather modelling and oceanography.
Quantifying the probability that a system (like a coastal defence, or a stock market) will fail, over some period of operation, often critically depends on models of extreme (or rare) events, to which the system is exposed. If we understand the extremes, we can design the system with sufficient reliability. This post introduces extreme value modelling and outlines some practical challenges. We also provide links to recent contributions by the authors.
A typical prediction problem in data science involves trying to estimate what we expect to happen in situations we haven’t yet observed, and maybe quantify the uncertainty of a prediction. Usually, we are trying, in some sense, to interpolate between situations we think we understand (maybe because we have observations) and intermediate situations for which predictions are needed. Modelling extremes presents a different kind of challenge. Now we might want to predict the magnitudes of very rare events, which are likely never to have been seen before. In this sense, we need to extrapolate. The central limit theorem tells us that the distribution of parameter estimates in an empirical predictive model often tends to a Gaussian distribution as the number of observations increases. This allows us to quantify the uncertainty of predictions. When modelling extremes, there are similar asymptotic theorems describing the distribution of maxima of random variables (over a large spatial or temporal interval, say) and the distribution of exceedances of a high threshold. These theorems provide a basis for fitting the tails of distributions of individual system output variables.
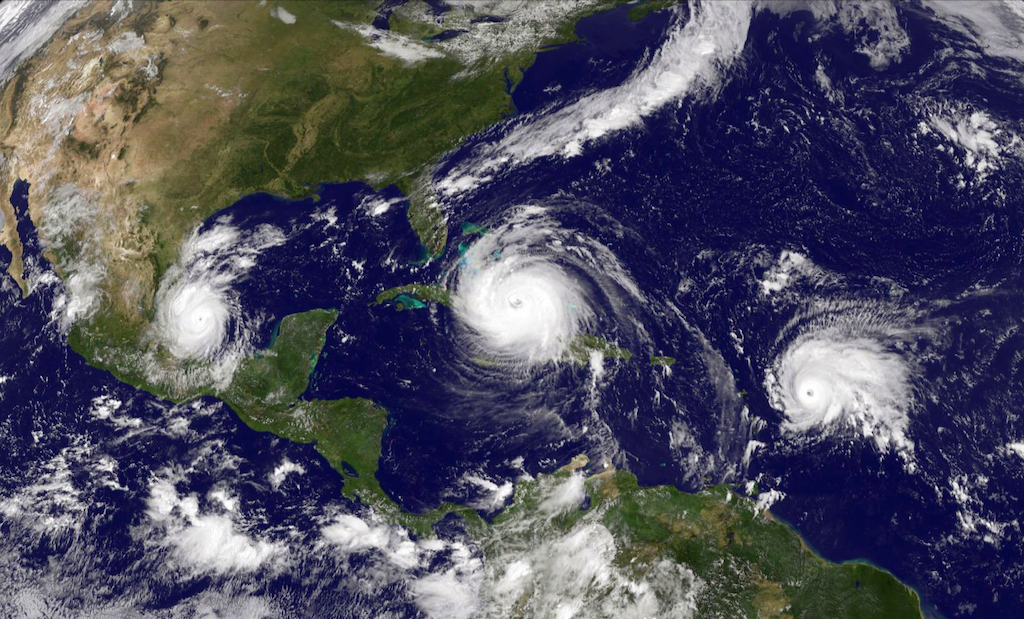
In practice, estimating extremes is complicated by many effects. We sometimes want to describe the tails of multivariate distributions, where some variables might be extreme, and other variables not. We might be interested in modelling extremes in space, or in time. In all these cases, specifying a model for the joint behaviour of random variables with appropriate asymptotic characteristics is important. Extremes from our physical environment (like atmospheric pressure fields, ocean waves, rainfall, river levels, earthquakes and heatwaves) typically depend on covariates: so the tail of the wind speed distribution might depend on the characteristics of the pressure field generating it (see the Figure) and the relative position of the observation location. This means we have to allow model parameters to vary with such covariates.
There is an active community of “extremist” (!) researchers in statistics and applied disciplines, both in academia and industry. Researchers at Shell have developed efficient computational methods to estimate non-stationary marginal, conditional, spatial and time-series extremes, often facilitated by long-standing collaborative projects with universities such as Lancaster. The holy grail in risk assessment is to be able to characterise and quantify all sources of uncertainty, including data measured with error, and approximate or misspecified models, so that system design and operational decisions are made as well as possible.
Competing Interest: Matthew Jones is a Statistician at Shell; Philip Jonathan is Chief Statistician at Shell, and Chair of Environmental Statistics and Data Science at Lancaster University.
Keywords: Oceanography; Extreme Value Statistics; Sustainability
This is the blog for Data-Centric Engineering, an open-access journal published by Cambridge University Press and supported by the Lloyd’s Register Foundation. You can also find us on LinkedIn. Here are instructions for submitting an article to the journal.